We recently posted some pretty amazing metrics. The 2024 school year brought us our highest graduation rate yet, and our staff and students committed more of their time and energy than ever before. Our numbers rose in all areas, from Student Advisement to Community Service, and everything in between.
These numbers are fantastic. But outside of values in a spreadsheet, what do they actually mean?
Let us tell you about who we're measuring for.
Somewhere right now, a student who was never supposed to make it is making it. Maybe she's the first in her family to fill out a college application. Maybe he's the kid who stopped showing up in October — until someone noticed, and kept noticing, and didn't let him disappear. Maybe they're the student no one could quite reach, until one counselor found the right door.
That's who is behind our numbers.
When people hear that our graduation rate sits at 96% among students identified as at-risk, the most common response is some version of: how?
It's a fair question. These are students the system has often already half-counted out — students facing poverty, instability, trauma, language barriers, and a hundred other things that don't show up on a report card. A 96% graduation rate among this population doesn't happen by accident. It doesn't happen because of a program description in a grant proposal. It happens because of relationships that are built one conversation at a time, over months and years, by counselors who know their students' names and their grandmothers' names and the specific shape of what "struggling" looks like for each individual kid.
Success doesn't look the same for every student we serve. It never has. For some, it's a four-year college acceptance letter. For others, it's a trade certification, a military commitment, a first stable job, or simply — and this is not "simply" at all — staying. Finishing. Walking across a stage that once felt impossibly far away.
Our data reflects all of those outcomes, because we made a choice a long time ago to count them all.
We want to be honest about something, though.
The 4% keeps us up at night.
We don't bury that number in a footnote. We don't explain it away or let it disappear into an annual report. Every student who didn't cross the finish line is a person we think about. A conversation we replay. A moment we wonder if we could have done differently. That 4% is not a failure statistic — it's the thing that keeps the work honest. It's what separates a program that genuinely cares from one that just reports.
Here is the math we actually care about
One graduate changes a family. A parent who sees what's possible for their child begins to imagine differently. A younger sibling watches and takes notes. A neighborhood gets a different story about what kids from here can do.
One graduate, multiplied across a community, across a generation — that's not a graduation rate. That's a ripple that doesn't stop.
We are proud of our numbers. We are prouder of the people behind them.
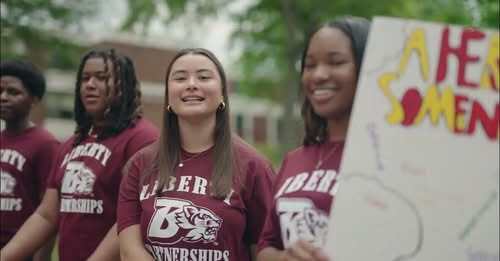
The Liberty Partnerships Program at Binghamton University serves students across Binghamton City School District, Susquehanna Valley School District and Johnson City Central School District. Our counselors work side by side with school staff, families, and community partners to ensure that every student has someone in their corner — from middle school through graduation and beyond.